Quickstart: An introduction to SyncroSim
This quickstart tutorial will introduce you to basics of working with SyncroSim, using a simple demonstration model for generating sales forecasts of hybrid and electric vehicles. The steps we will lead you through include:
- Installing a Package
- Creating a new Library
- Viewing and editing model Datafeeds
- Running a Model
- Analyzing the Results
As you complete this introduction you will also become familar with the Library Explorer, the Run Monitor, and the Time-Series Chart Window.
Note
This Quickstart Guide uses SyncroSim for Windows, and assumes that you've already installed the necessary software on your computer. Click here if you haven't yet installed the software.
Step 1 - Install the Demo Sales Package
The first step in using SyncroSim is to install one or more SyncroSim Packages. Each Package specifies the model (i.e. calculations) to be run, including the format for all of the model's inputs and outputs.
For this demonstration we will use a simple Package designed to generate sales forecasts, called the Demo Sales Package. To install this Package, go to the File menu and choose Package. This will open the Package Manager window.

The Package Manager displays all the SyncroSim Packages that are already installed on your local computer. If the Demo Sales Package does not already appear in this list, click the Install... button. This button will show you a list of all the available Packages on the SyncroSim Online Package Server not yet installed on your local computer. Click the check-box for the Demo Sales SyncroSim Base Package and then click OK.

You should now see the Demo Sales SyncroSim Base Package displayed in the Package Manager shown in the first image above.
Step 2 - Create a new Demo Sales Library
Having installed the Demo Sales SyncroSim Base Package, you are now ready to create your first SyncroSim Library. A Library is a file (with extension .ssim) that contains all of your model inputs and outputs. Note that the format of each Library is specific to the Package for which it was initially created. To create a new Library, choose New Library... from the File menu.

In this window:
- Select the row for the Demo Sales SyncroSim Base Package. Note that as you select a row, the list of Templates available and suggested file Name for that Base Package are updated.
- Select the Demo Sales - Basic Template as shown above.
- Optionally type in a new Name for the Library (or accept the default); you can also change the Location of the file using the Browse... button.
When you are ready to create the Library file, click OK. A new Library will be created and loaded into the Library Explorer. If the current library is not up to date, you will be prompted with an Update Library window. Click Apply to update and then, you will be directed to the Library Explorer.
Step 3 - Review the model inputs
The contents of your newly created Library are now displayed in the Library Explorer. Model inputs in SyncroSim are organized into Scenarios, where each Scenario consists of a suite of values, one for each of the Model's required inputs.
Note
Normally you begin by creating a new Scenario and then adding data to it. However, because you chose the Demo Sales - Basic Template when you created your Library, your Library already contains two pre-configured Scenarios with model inputs. These inputs were filled in and distributed as a sample with the Package to help you get started quickly, and correspond to sales data for electric and hybrid vehicles.

As shown in the image above, the Library you have just opened contains two Scenarios, each with a unique ID. The first of these Scenarios (with ID=1, as shown above in square brackets) is named Expected future sales - past trends continue; this Scenario contains a suite of model inputs corresponding to the assumption that future car sales will continue as in the past. The second Scenario (with ID=2 and named Expected future sales - increased demand for electric) contains model inputs corresponding to the alternative assumption that sales for electric vehicles will increase over time.
To view the details of the first of these Scenarios:
- Select the Scenario named Expected future sales - past trends continue in the Library Explorer.
- Right-click or double-click and choose Properties from the context menu to view the details of the Scenario.
This opens the Scenario Properties window.
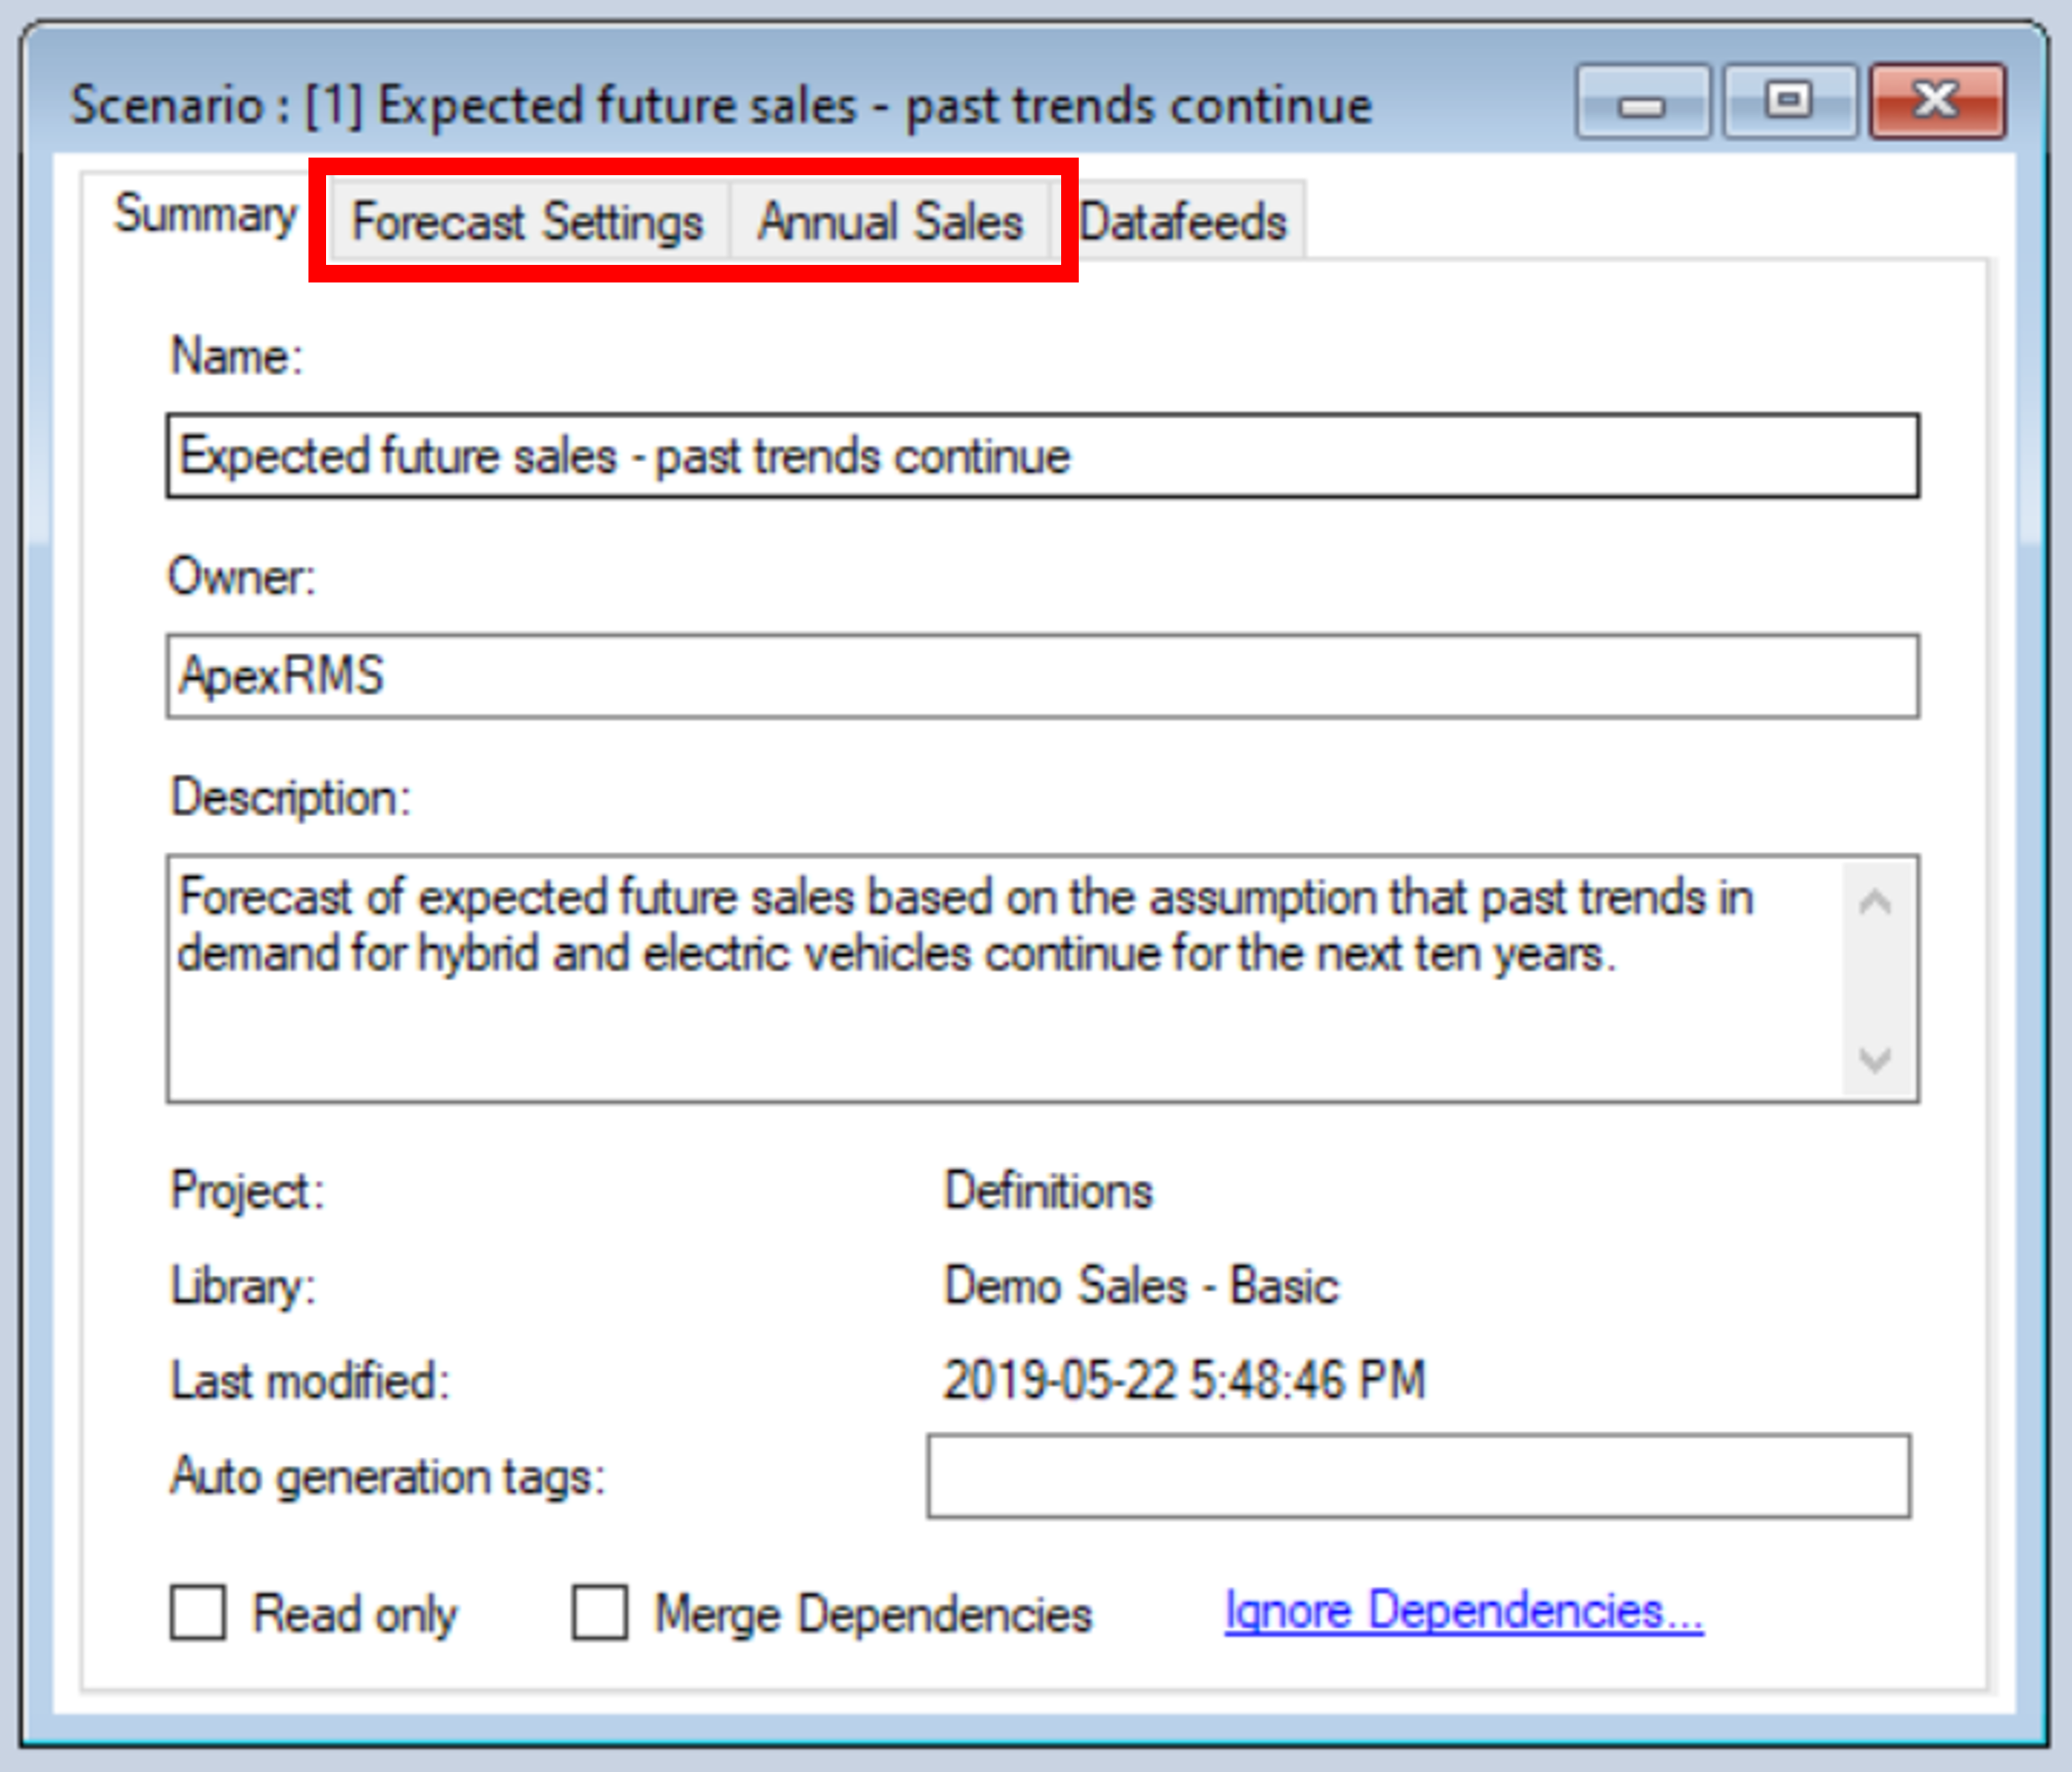
The first tab in this window, called Summary, displays some generic information for the Scenario, while the next two tabs (Forecast Settings and Annual Sales) display the values assigned to this Scenario for each of the model's two input Datafeeds (summarized in the last tab Data Sources - see image above). The Annual Sales Datafeed is shown below.

SyncroSim provides you with several alternatives for moving tabular and raster data in to and out of your Library, including built-in support for import/export using Microsoft Excel. You can learn more about modifying data within SyncroSim Datasheets in our Editing Data guide.
Note
The contents of each Scenario are editable. You can also make a copy of a Scenario using the Copy-Paste commands under the Edit menu. If you make changes to any of the contents of your Library, select Save All from the File menu to save your changes.
Step 4 - Run the model
You are now ready to Run one or more of your Scenarios.

To Run a Model:
- Select a Scenario in the Library Explorer.
- Click the Run
 button in the toolbar.
When you click the Run button, the Run Monitor will appear and show you the status of the currently running Scenarios. (You will also see a Progress Bar in the lower-left of the Main Window while the model is running.)
When the Run is finished, the Run Monitor will indicate that the Scenario's status is Done.

Step 5 - Analyze the Results
Once the Run is complete you are ready to analyze the results.

First, however, note the changes that have occurred in the Library Explorer. If you expand the nodes below the Scenario you just ran you will see that it now has a new Results folder containing a new Scenario. This Scenario is called a Results Scenario. To visualize the Results Scenario properties, double-click it or right-click and choose Properties from the context menu.
Note
Everytime you Run a Scenario, SyncroSim will create a new Results Scenario with a name that is date/time stamped. As with other Scenarios, a Results Scenario is identified with a unique Scenario ID in square brackets. These values are automatically generated by SyncroSim when the Scenario is first created and cannot be edited. Each Results Scenario contains both the output for the Run and a snapshot read-only copy of the model inputs at the time of the Run.

To analyze Result Scenarios in SyncroSim you use the Results Viewer at the bottom left corner of the screen.
The image above shows the Results Viewer for our Demo Sales Library. Because you used Demo Sales - Basic Template to create this Library, there are already two pre-configured charts available: Gross Revenue by Item and Units Sold by Region (Hybrid Type only). These charts were created using the Time-Series Charting tool, which is the only tool available in the Results Viewer for this type of Library. For Libraries that contain spatial data, an additional Maps tool also appears as a tab on the Results Viewer.
This tool can be used to create new charts or open existing charts. To create a new chart, you can click on the New Document symbol in the Results Viewer (see image below). For more information, see Creating a Chart. For this tutorial, you will open existing charts for visualizing the results of your model run.

To open an existing Chart:
- Select the Gross Revenue by Item Chart in the Charting tool as shown above.
- Double-click it or click the Open button on the right side of the toolbar.
You can now view the results of running your Scenario through the Model from the Demo Sales Package. If you repeat Steps 4 and 5 again for the second Scenario in your Library, your charts will automatically compare the results of both Scenarios.

Note
When you are analyzing the results of a Run, you are actually analyzing one or more Result Scenarios. You can add or remove Results Scenarios by selecting a Scenario in the Library Explorer and then choosing either Add to Results or Remove from Results under the Scenario tab or by right-clicking on the scenario and selecting your choice from the context menu. Scenarios currently selected for analysis are highlighted in bold in the Library Explorer.
What Next?
- Take a look next at the some of the How-To-Guides
- Learn how to create your own SyncroSim Package
- Find out more about using the R or Python Programming Languages with SyncroSim