Map Window: Customizing a Map
Once you've created a Map you can customize it using the Toolbar at the top of the Chart Window. You can also use the Toolbar to set Info mode or Pan mode, Zoom the current Map Panels, and set the Panel size.
Setting the Timesteps

By default, the Timesteps text box contains the last valid timestep in your output data.
You can specify a new set of timesteps by entering them in the Timesteps Text Box. Timesteps can be specified as single integers and as ranges of integers. Some examples are:
- 2018
- 2018,2022
- 1000-2000
- 1,2,3,4-10
Important
The Timestep values must be valid for the current set of Scenarios.
Tip
If you delete all values from the Timesteps text box it will be re-populated with default values (i.e. typically the full range of timesteps) the next time you click the Apply button.
Setting the Iteration

Maps can only be displayed one Iteration at a time, and by default the Iteration control is set to the last valid Iteration in your output data. You can specify a new Iteration using the Iteration control's numeric up-down buttons.
Info, Pan, and Zoom

The next section on the Toolbar contains buttons for setting the Interactive Mode and for Zooming the current set of Map Panels.
The Info button  sets the Map interactive mode to Info. When the interactive mode is Info, you can click on an individual pixel in any Map Panel and see detailed information about that pixel.
The Pan button  sets the Map interactive mode to Pan. When the interactive mode is Pan, you can move the images in each Map Panel in any direction using the mouse. To use the Pan feature, hold down the left mouse button and drag the image in any Map Panel.
The Zoom In button  will zoom in all of the current Map Panels. The Zoom Out button
  will zoom out all of the current Map Panels. The Zoom Full button
  will reset the zoom level to default.
Setting the Panel size

You can change the size of map panels by choosing a percentage from the Panel size drop-down menu. For example, while a panel size of 100% is the default size of map panels, changing the panel size to 200% will double the size of all panels.
Other Options

A variety of other options are available from the Options dialog. To open the Options dialog, click the Options button in the Toolbar. You will find the Options dialog is divided into the following sections:
Labels
| Option | Description |
|---|---|
| Scenario name | Shows the Scenario name as a Map label. |
| Scenario ID | Shows the Scenario ID as a Map label. |
| Indicator | Shows the Variable name as a Map label. |
| Timestep | Shows the Timestep as a Map label. |
| Timestep prefix | Shows 'Timestep' as a prefix to the Timestep label. |
| Timestamp | Shows the date and time the Result Scenario was completed. |
Tip
These options are also available from the Context Menu by right-clicking on a Map.
Label fonts
Customize the fonts for Scenario, Indicator, and Timestep labels.
Arrangement
Choose the arrangement of Scenarios, Indicators, and Timesteps into columns and rows, and select the priority each item should be displayed in using the Order option. The Nest labels check box allows you to either aggregate or disaggregate the dispaly of map labels.
Editing the Legend
The Criteria Window will show a Legend for each of the Variables you have selected. Depending on the type of the Variable, these colors can have one of two sources:
Project Datafeed
The Legends for some Variables are generated based on the colors assigned to the Project Datafeed associated with that Variable. For example in the stsim Package the colors in the Legend for the State Class Variable shown in the Main Window example come from the colors assigned to the corresponding State Class Project Datafeed.
To change the Legend colors for this type of Variable you must edit the colors in that Variable's associated Project Datafeed.
Tip
If you double-click a Legend node, the appropriate Project Datafeed will open automatically.
Note
You must click the Apply button for these changes to be reflected in the current Map.
Custom Legend
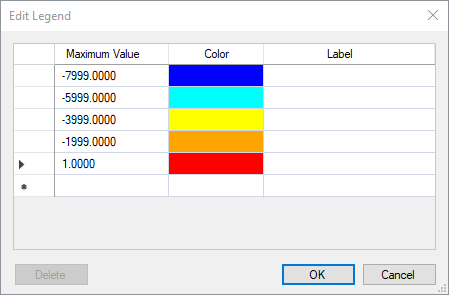
Some Variables do not have an associated Project Datafeed. Rather these Variables are assigned a default Legend. You can change the Legend colors for these types of Variables using the Legend Editor:

To open the Legend Editor, double-click on the Legend you want to edit. In this dialog, you can create a custom Legend by assigning colors to any number of Maximum Values. You can also assign a Label for each color which will appear in the Legend instead of the Maximum Value.
Once you have configured the Legend colors, click OK and the changes will be immediately reflected in the Legend and in the Map Panels.
Tip
You can reset the Legend colors to default values by right-clicking and selecting Default Legend in the Legend's Context Menu.