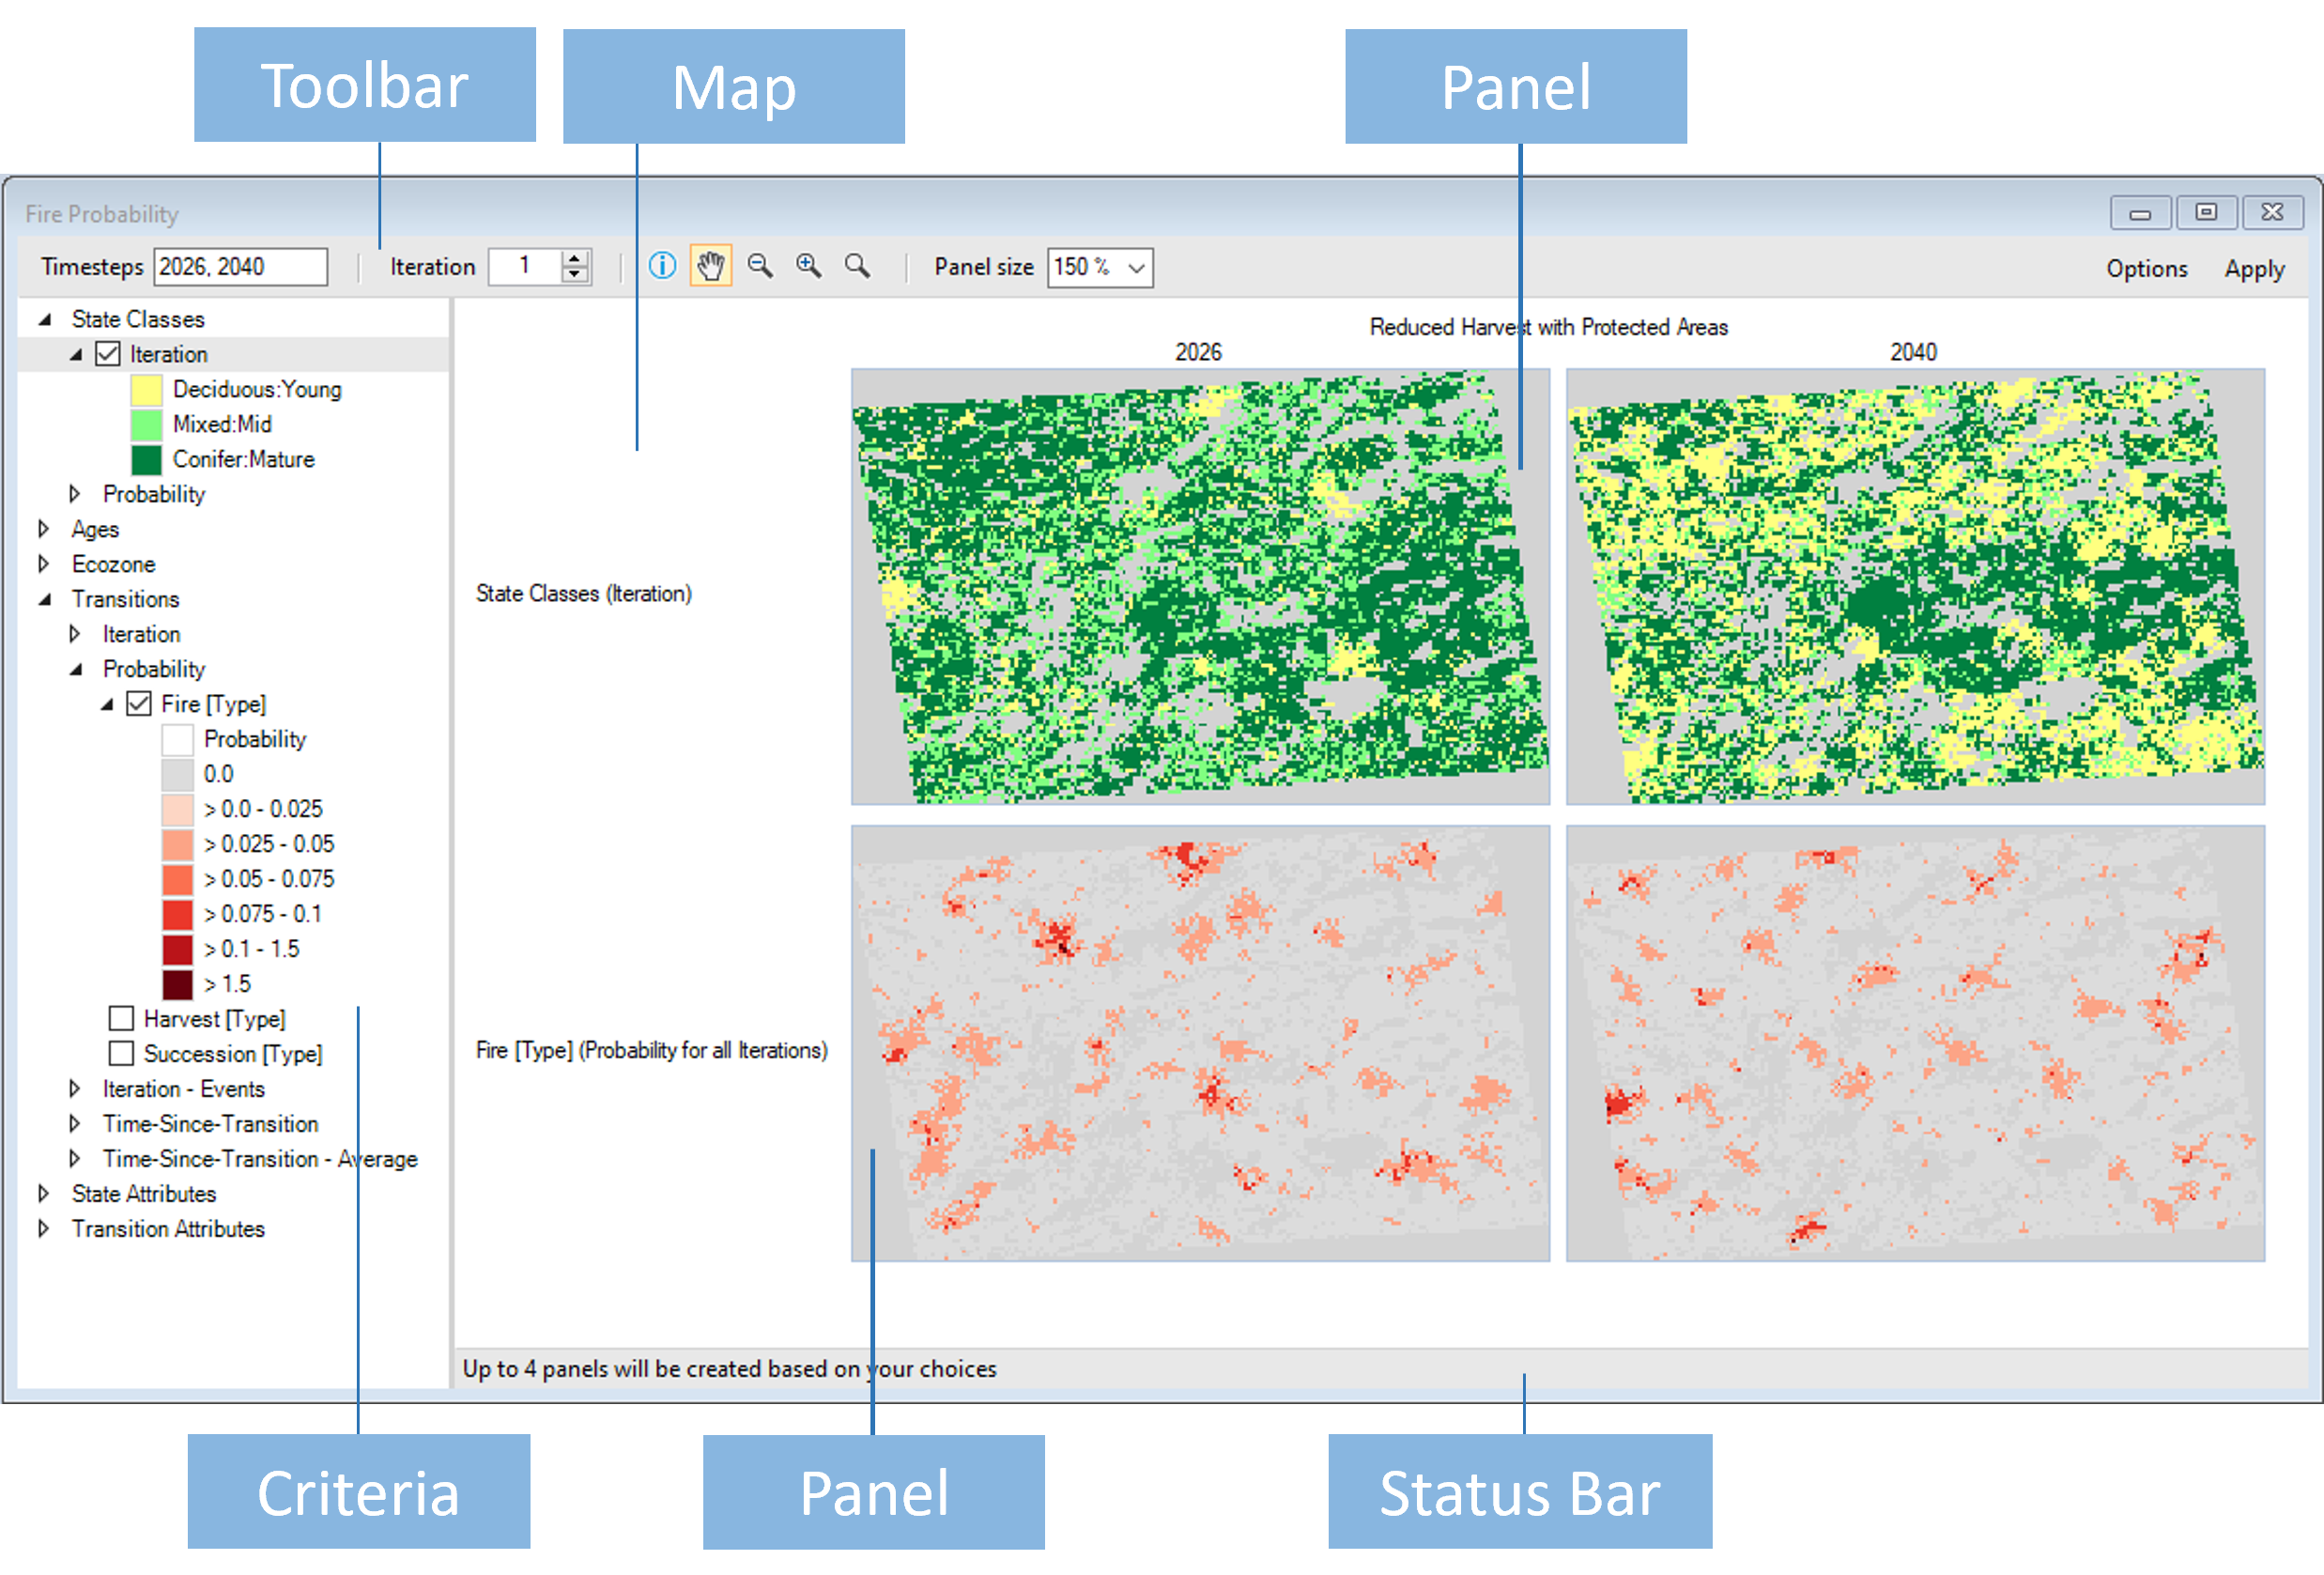
Map Window: Overview
The Map Window in the Results Viewer lets you create Maps to help you analyze your Results Scenarios. Similar to the Chart Window, the Map Window allows you to compare spatial data from multiple Scenarios at the same time, including results of spatio-temporal Monte Carlo simulations.

Map Window Layout
Note that the Map Window is divided vertically into two child panes:
Criteria Pane
The pane on the left is the Criteria Pane. You use the Criteria Pane to choose the Variables you want to see in your Maps.
Map Pane
The pane on the right is the Map Pane. This window contains the Map and all of its Map Panels.
Map Panel Layout
The layout of the Map Panels is as follows:
- Each Variable is displayed on a separate row.
- Each Timestep is displayed in a separate column.
- Multiple Scenarios will have separate horizontal groups of Variables and Timesteps.
- Maps can only be viewed one Monte Carlo Iteration (i.e. realization) at a time.
Note
The arrangement of Variables displayed in rows and Timesteps displayed in columns can be modified in the Options dialog. See Customizing a Map for details.
Using the Toolbar

You can use the Toolbar at the top of the Map Window to set the Timesteps, Iteration, and Panel Size for Panels visible at the same time. The Toolbar also contains buttons to set Info mode or Pan mode, Zoom in and out of the Maps, and access the Options dialog.
Note
The Timestep control requires you to click the Apply button for your changes to be reflected in the current Map. The other controls will immediately update the Map if appropriate.