Analyzing Results: Overview
When you "analyze the results" of Model Runs, what you are really doing is analyzing one or more Results Scenarios.

The image above shows the Library Explorer after the Scenario with an ID of 1 has been run. As you can see, this Scenario now has a Results Folder containing a new Results Scenario with an ID of 8. Note also that Scenario [1] now has green arrow overlay  indicating that the Scenario has valid results.
Tabular Output
In general model output is written to one or more Output Datafeeds. The format of the output from a Model Run depends on how the Package author configured the display of their Output Datafeeds.
The simplest way for a Package to display the model output is to add one or more tabular Output Datafeeds directly to the Results Scenario created by each Model Run.

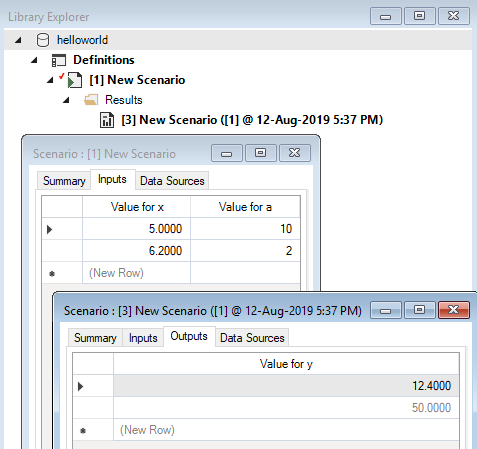
As shown in the very simple helloworld Package example above (with a one-line model of y = xa), Scenario [3] is a Results Scenario associated with a Model Run of Scenario [1], and thus has an extra Outputs tab to show the Package's only Output Datafeed.
Tip
As with all Datafeeds, you can export the contents of an Output Datafeed using the Export option from the Edit menu.
Results Viewer
For those Packages that produce either time-series or spatial (i.e. map) output, SyncroSim provides a built-in Results Viewer to help view and analyze model output using both Charts and Maps.

The image above shows the Results Viewer for a Library created by the demosales Base Package. The only Results Viewer tool that this Package supports is Charts, and so that is the only tool that is displayed.

The second image, however, shows the Result Viewer for a Library created by the stsim Package. Note that there are three tools now: one for Charts, one for Maps, and one for Export (which allows you to export tabular reports and GeoTIFF images).
Note
The Results Viewer provides built-in support for visualizing output from spatio-temporal Monte Carlo simulations.
Adding Results Scenarios to the Results Viewer
When using the Results Viewer, you must first add the Results Scenarios you wish to view to the set of viewable results. Those Scenarios currently in the set of viewable results are all displayed in bold in the Library Explorer. For those Results Scenarios in the set of viewable results, you can further toggle which of these Scenarios to actually make active for viewing. Scenarios with a red check-mark are currently active.

In the example above, Scenario [8] has been automatically added to the Results Viewer at the end of the Model Run (and so it is bolded and has a red check-mark next to it in the Library Explorer). However, you can manually add/remove Scenarios from the set of viewable results using the Library Explorer's Context Menu. For example, to remove a Results Scenario from the viewable results:
- Select its node in the Library Explorer (e.g. Scenario [8]).
- Right-click to show the Context Menu.
- Choose Remove from Results.
Activating and Deactivating Result Scenarios
Sometimes you have added multiple Scenarios to the set of viewable results and then you realize you would like to omit some of them temporarily from the ongoing analysis. You can accomplish this by selecting the node for the Scenarios you want to remove and choosing Remove from Results from the Context Menu.
A more convenient option, however, is to simply deactivate them since only active Result Scenarios are displayed in the Results Viewer. To activate and deactivate Results Scenarios, use the Results drop-down button in the Main Window Toolbar.

The image above shows the Results Toolbar drop-down. As you can see, there are two Results Scenarios in the set of viewable results, but - as indicated by the red check-mark - of these only Scenario [9] is currently active. To activate or deactivate a Scenario using this drop-down, click it and its state will be toggled.

The image above shows the Library Explorer with Results Scenario [9] active and Results Scenario [8] inactive. Scenario [9] has a red check-mark next to it because it is active, and Scenario [8] does not because it is inactive.
Note also that both parent Scenarios ([1] and [2]) are bolded because both of them have a Results Scenario in the set of viewable results. However, only Scenario [2] has a red check-mark because it is the only parent Scenario with an active Results Scenario.
Note
Many of the features described above are also available from the Main Window Scenario menu and toolbar.